


For the ETH Global Hackathon, a group of strangers came together with a few simple goals: have fun, learn, create something new that could help a lot of people, and to make some new friends. After a week of researching some cool, sophisticated offerings from sponsor we decided to make a chance of liquidation dApp that enables people to see the chances of having a DeFi loan liquidated on any given day. Before we post a link to the demo, let me explain where the data came from and how we managed to bring interactive simulation into the browser.
The Problem
DeFi lending and borrowing protocols require a user to deposit collateral. Then the depositor may borrow off that deposit up to a certain percentage of the collateral value. If the collateral value falls the user will need to either payback a portion of the loan, up the collateral, or risk being liquidated. To calculate the chance of a loan liquidating we looked at how token prices have moved in the past and how their movements related to each other. We retrieved historical on chain price data and sent the daily percentage changes in price, for 9 well known tokens, through an innovative formula called Metalogs.
Dehydrating and Hydrating Data
Metalogs encompass dozens of distributions and eliminate the need to guess which distribution the data will fit into the best. Determining the shape of historical token price changes 'analytically', effectively compresses a year's worth of price data down into 5 numbers that represent the shape of a token's price movement. I like to think of this process as 'dehydrating' rather than compressing as we will be able to rehydrate the shape later. The histogram in the image below shows the shape of historical price changes and applied that to the current price of a token to provide a view of today's possible price range.
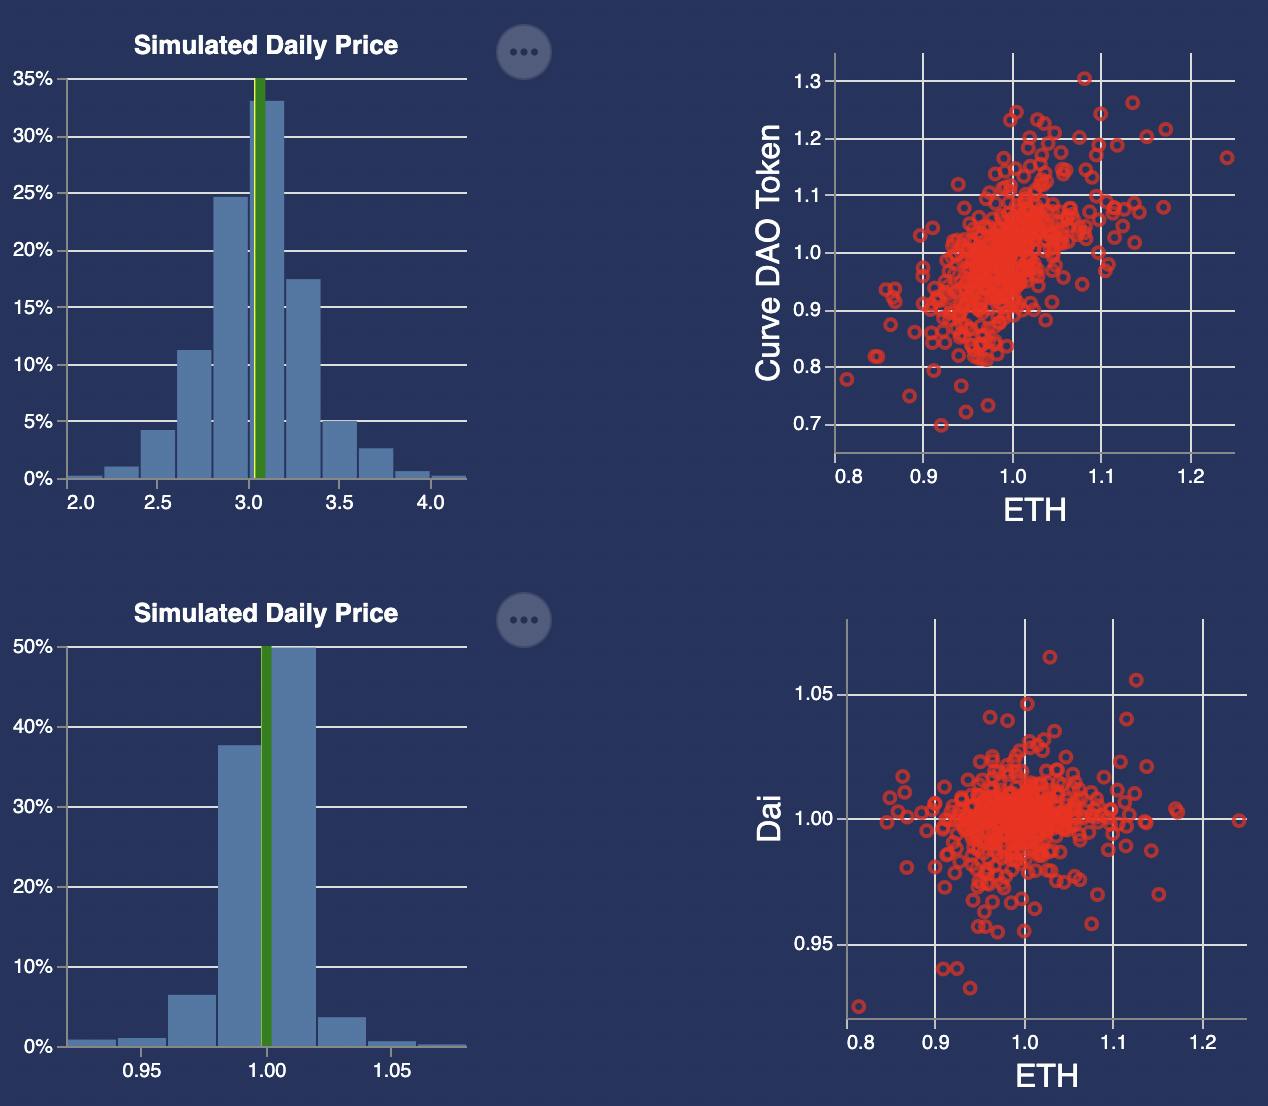
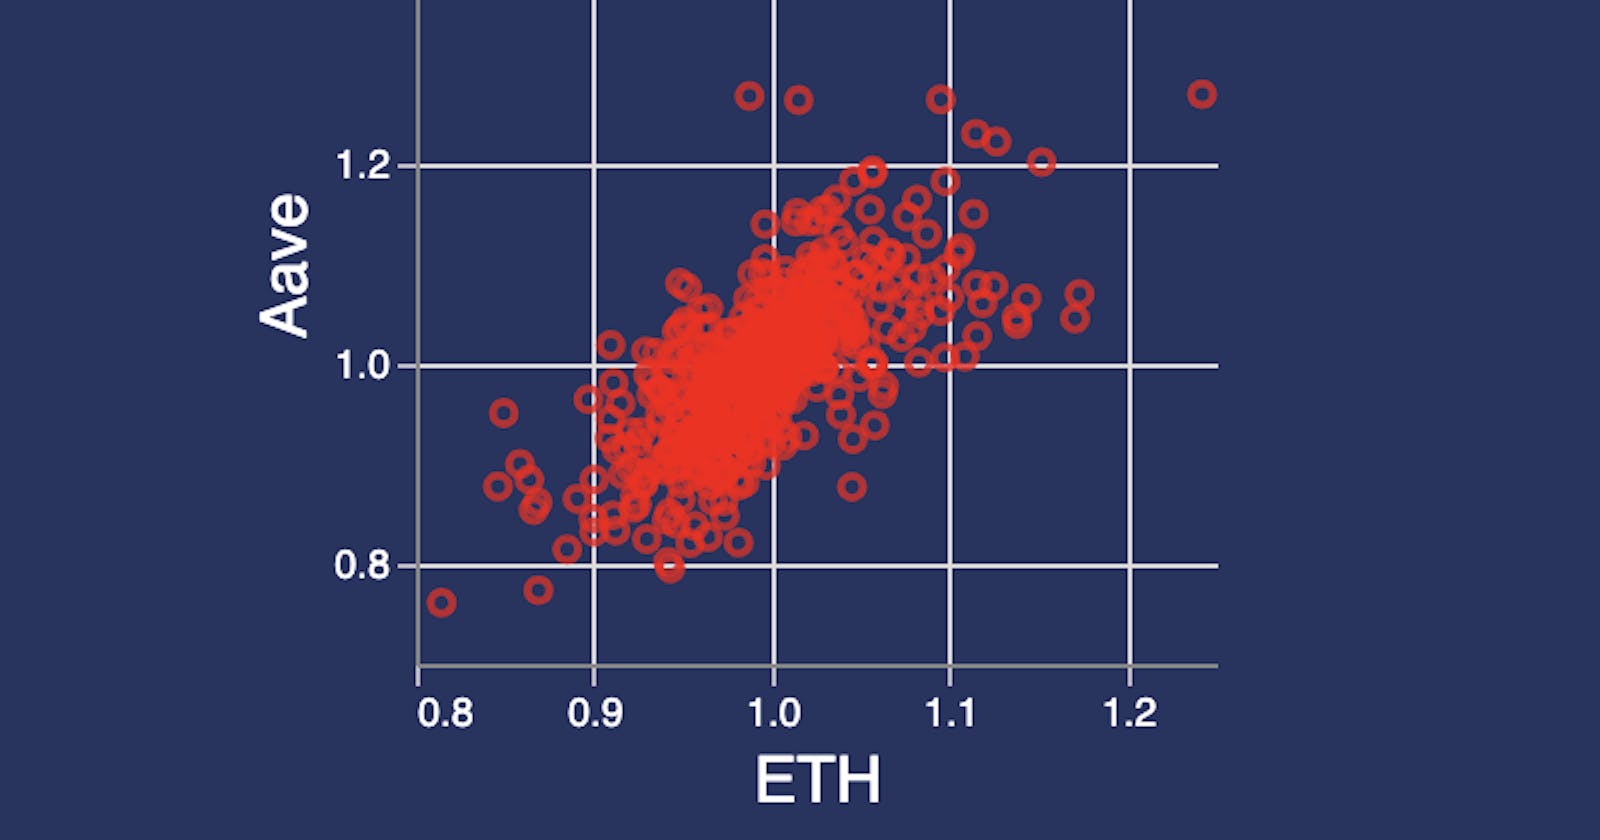
We are now able to simulate probability distributions in our dApp. But that's only half the story. We also captured the correlation of a token to every other token in the set. This can come in handy if you are using more than one token to collateralize a loan or want to simulate an exotic option. 'Will a synthetic 2x put option offset my liquidity risk?' or 'How should I allocation tokens in my portfolio to better match my risk tolerance?' You may see the relationship in how token prices move by viewing a scatter plot. In the example above we see a stronger positive relationship between ETH/CRV than we do ETH/DAI. The relationships were quantified and stored as a correlation matrix (9x9).
Decentralization For The Win
We stored the chance-data in a publicly accessible json file with metadata for transparency, auditability and replicability and digitally signed it. All our dApp needed to do was to pull in the json file from IPFS then 'hydrate' the distributions in the browser/app. The simulation trials preserve the relationships across distributions which gives them a special property of being additive. This historically was only possible with massive scenario databases found in TradFi. We now have 'DeFi-Distributions' or what I like to call chance-data. 🚥
The hackathon version of the dApp may be accessed here: ChanceOf.xyz While we didn't win best of show we did manage to win three sponsor awards and were encouraged to continue development. Thank you, Conjure Finance, Alchemy and Chainlink. Check it out and let us know what you think. Join the discord if you'd like to contribute or follow along.