

Metalog Distributions Will Transform Data Science
a flexible continuous probability distribution designed for ease of use


A common technique in data science is that of data fitting or curve fitting. The process of constructing a curve that best fits to a set of data is super helpful. It reduces what may be a massive amount of data into a few parameters to send through a function/math formula. Historically analytics professionals would fit data into a probability distribution. The most well-known being a so-called normal distribution aka Gaussian distribution. There are over a hundred distributions mostly named after dead statisticians. The trick, art, sorcery is to pick the correct distribution for your data. This is not always an easy task. Which distribution? What parameters should feed that distribution? It's not fun and requires specialized skills. Worst of all, techniques haven't advanced since the statistical heydays of the 1950s.
Enter Metalogs
In 2016 Tom Keelin published the first paper describing metalogs. Metalogs are just that - a distribution that comes after you've struggled to find the correct distribution to fit your data... kidding aside, metalogs encompass 60+ traditional continuous distributions in one technique that supports:
- virtually unlimited shape flexibility
- choice of unbounded, semi-bounded, and bounded distributions
- ease of fitting to data with linear least squares;
- simple closed-form quantile function (inverse CDF) equations
- easy to use in interactive simulations;
- simple closed-form PDF
- Bayesian updates in closed form
- flexible number of terms depending on the degree of shape flexibility needed
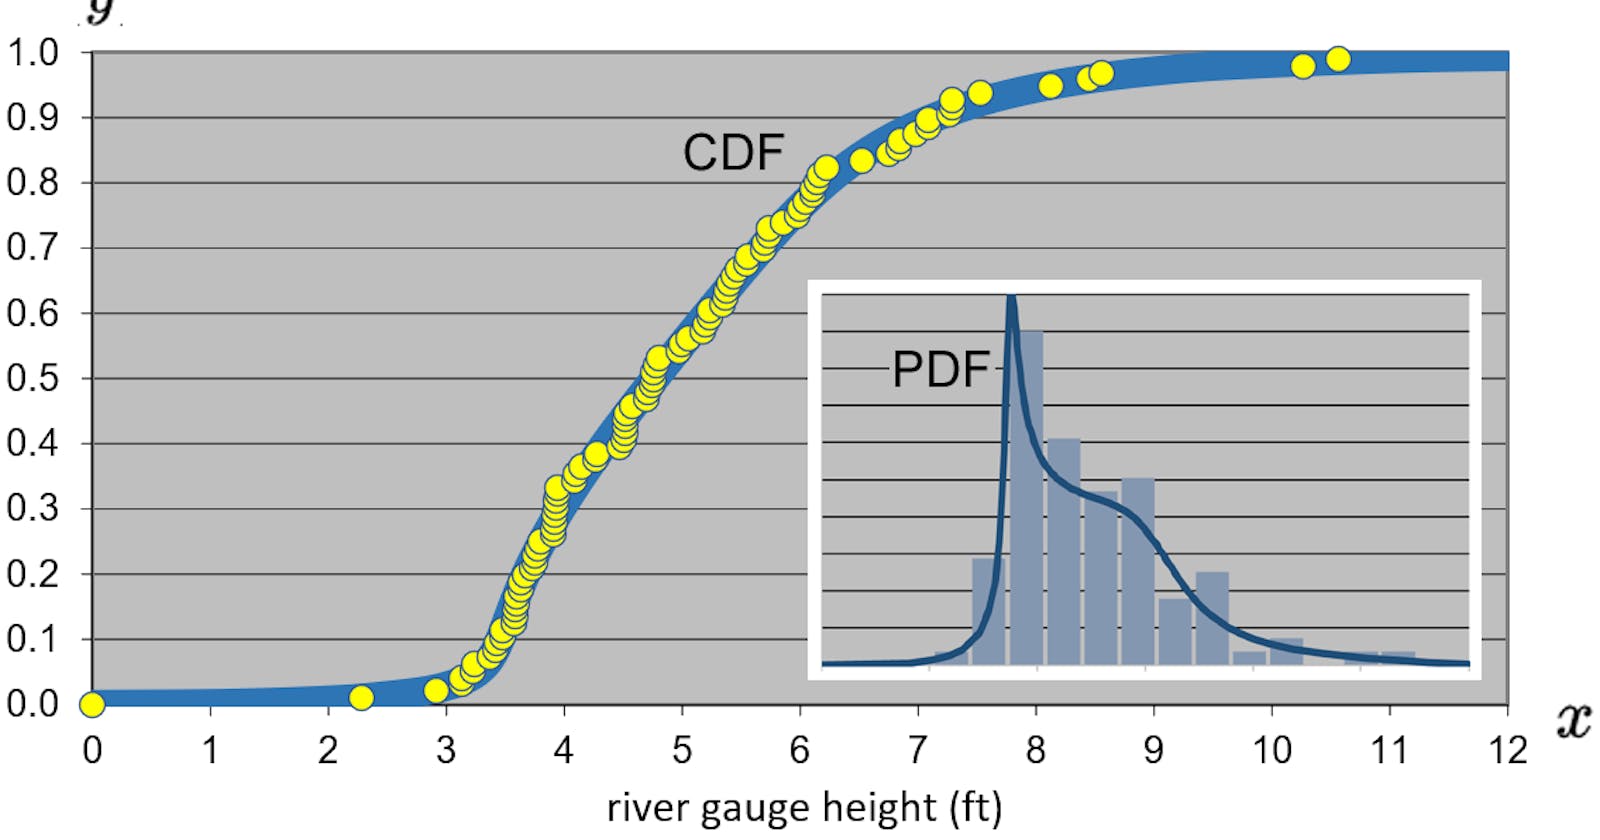
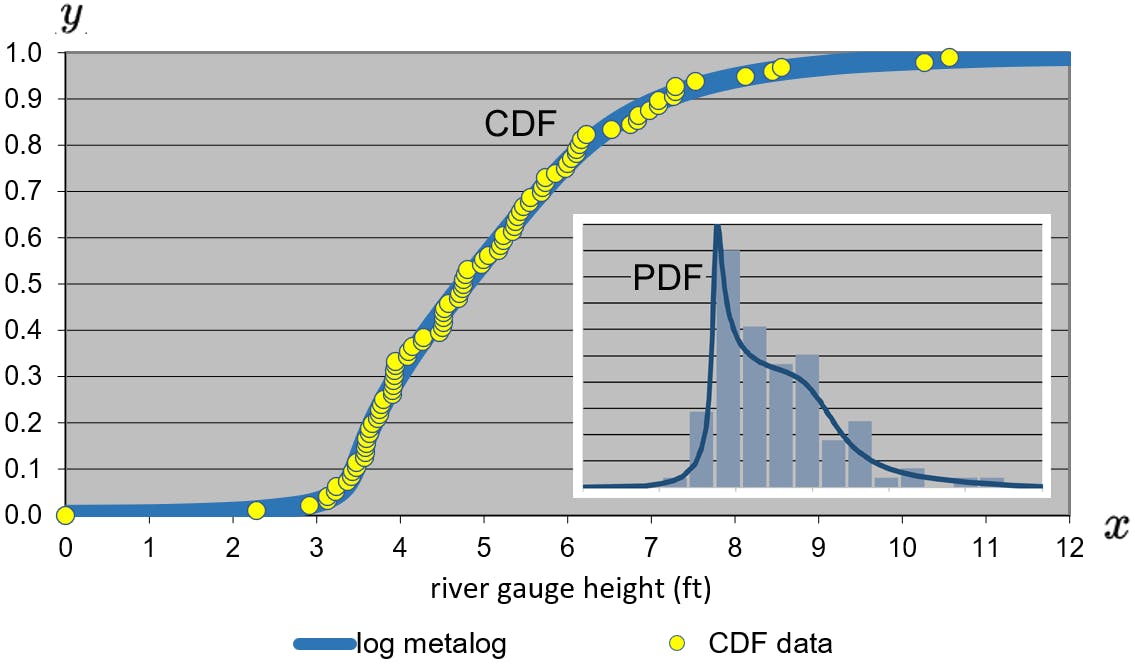
If any of that sounded Greek to you think about it this way, we can 'fit' data using a metalog and we don't need to do as much guessing as to which dead statistician distribution has the best fit for our data. We can turn to one formula for virtually any shape.
 Source Wikipedia
What's The Catch?
So while we don't need to remember which of the 60+ dead statistician distributions to use we do need to be smart about the parameters used in setting up a metalog as there are a few variation. Technically there are symmetric-percentile triplet (SPT) metalogs, general (quantiled) metalogs and generalized metalogs but let's think of it as two main types: Quantiled and Generalized and at that let's focus on the easiest to get started with, a type of quantiled metalog, the SPT metalog.
Some Examples
Fitting DeFi Smart Contract Exploits Using Metalogs
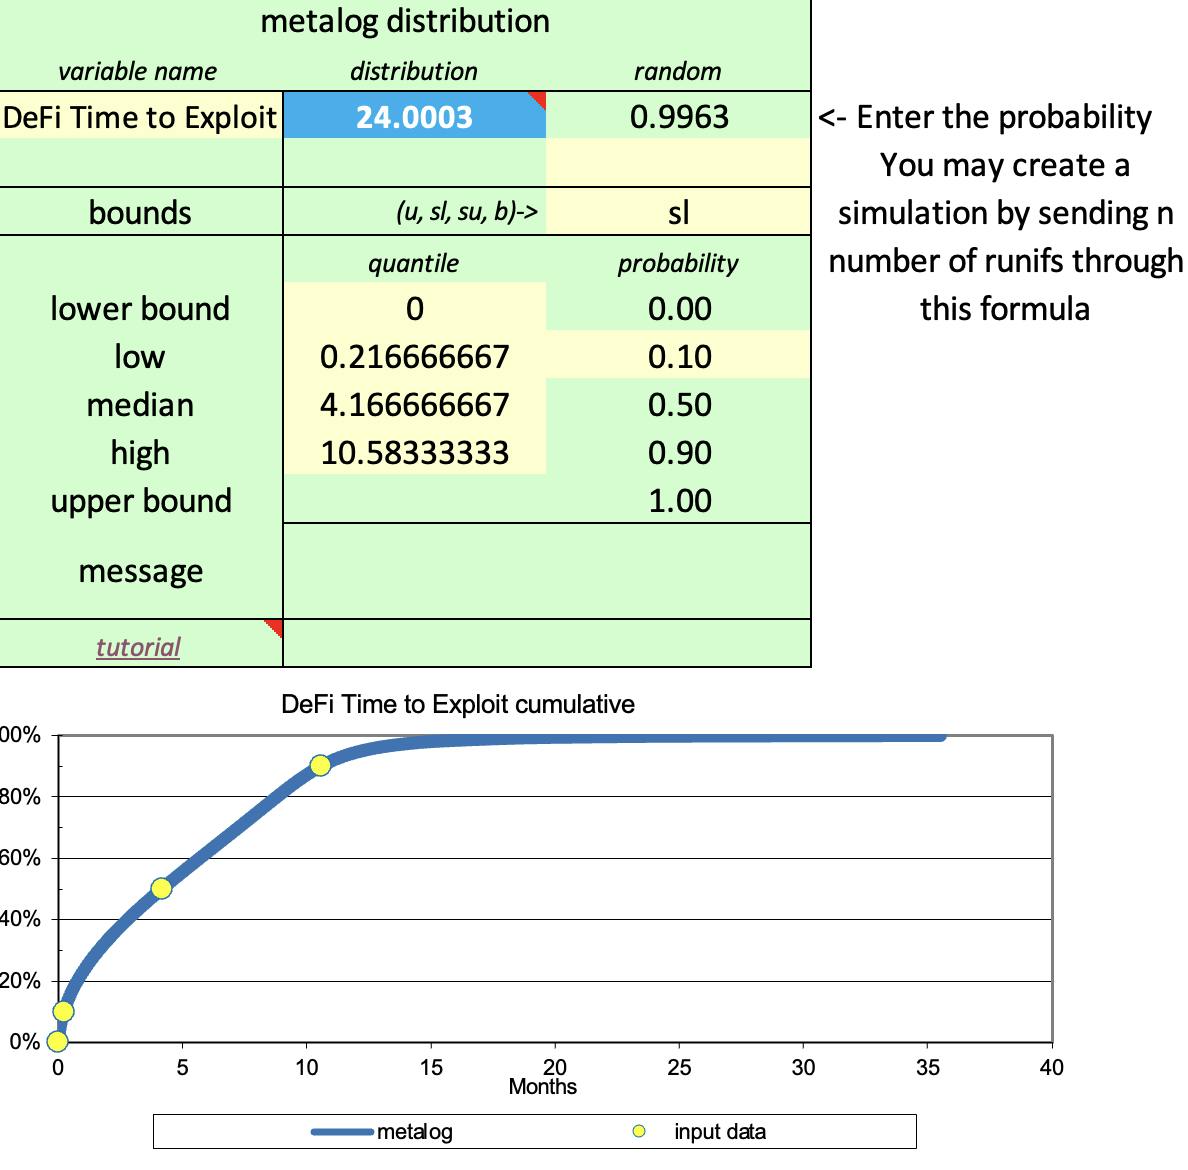 The image above is from a recent study of DeFi smart contract exploit times. The data set I used in the study was assembled by the team at Solace, stewards of a smart contract insurance protocol. We measured the historical time that had passed from contract release to the exploit occurred. Using the SPT metalogs, which takes in parameters for the upper and lower bounds, if any exist. For example. a lower value of 0 days was used in our study and no upper limit. Three symmetric percentiles are also needed: the median (50th percentile), and the symmetric high and low probabilities. For example the p10 for the lower, p50 for the median, and p90 for the upper. Our p90 was over ten and a half months. The user could fit the metalog with p5-p50-p95 or whatever percentiles they want if they are symmetric to the median. This can come in handy if you are looking tail risk.
We use this distribution to help figure out things like policy pricing. Having a sense of what's happened historically across smart contracts, protocols and networks provides 'a' probabilistic input for policy pricing decisions. Looking at the image above, if we changed the probability to another value we'd learn that the time to contract exploit is x months old or less. (YMMD, DeFi is a young industry!)
Volatility and Value at Risk
There is another variation of the quantiled metalog, it's called the ELD or equally likely distance. I like to think of it as the method that does some of the heavy lifting for me. ELD is great for things like data streams of crypto/token percentage price changes which are used to shape volatility. The ELD metalog generates aCoefficients and those aCoeffs are used to calculate the value at any probability in the distribution. Why settle of someone's average volatility when you can have the entire distribution in one formula and a few coefficients? The image below shows the probabilistic daily price range for two cryptocurrencies based on metalog distributions that captured the shape of each token's historical price movements.
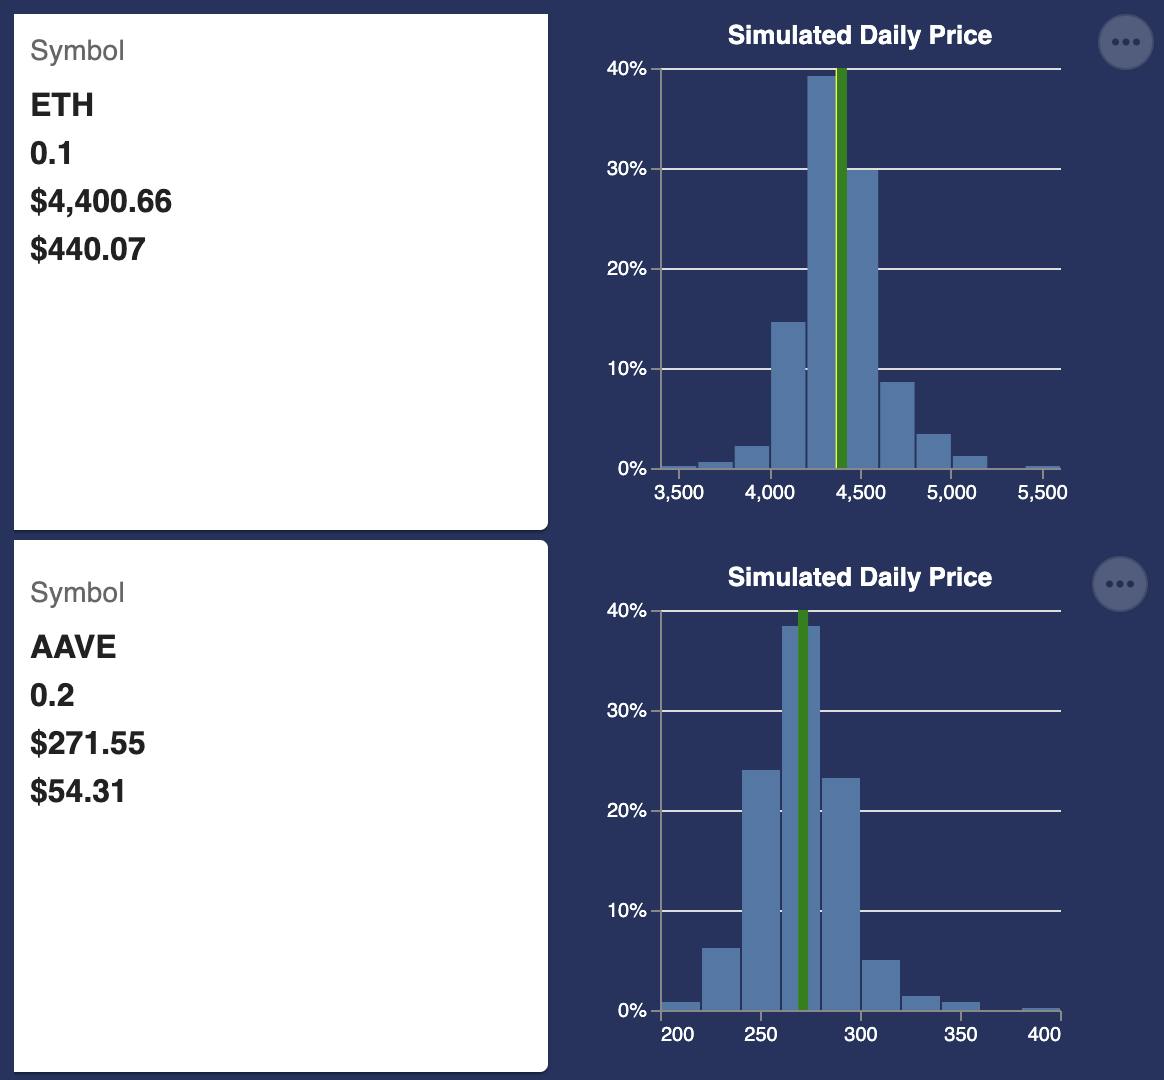
There are two situations when I turn to use ELD metalogs: 1) when we already have a Monte Carlo producing trials 'somewhere' (from some subject matter experts?) OR when it's ok to use historical data observations. I simply put the array/vector of either of those into the metalog to 'compress' the data down to a few aCoefficients that preserve the shape of the distribution. When I want or need to simulate (e.g. when aggregating those two tokens into a portfolio's value at risk), all I need to do is send in a random number (random uniform) of n trials and I've recreated the entire shape. Need just one point on the CDF? I send in the probability I want a value for and voila.
Learn More
I find this to be transformational stuff and hope you'll give metalogs a try. I find it hard to believe in 200 years data scientists will still be using dead statistician distributions when metalogs are so convenient and superior.
Hmm I suppose Tom Keelin will have passed by then
In another post I'll explain how to roll-up the portfolio risks but for now, if you have any questions or want to learn more, drop a comment here or better yet join the discord.