

Uncertainty Has A Shape
"Plans based on average assumptions are wrong on average." - Sam Savage


Whenever we look to the future there is uncertainty. When faced with uncertainty our minds scan for memories and information that can help us calibrate an answer to what might happen in the future. The same is true when it comes to AI models. However as AI models move closer to the edge the data that feeds them also needs to get to the edge device. When the volume of data gets too large to move the temptation is define the data in some smaller way. Averages are a convenient way to communicate as they compress history into a single number. Sadly, that 'compression' hides or loses the range of possible outcomes and leads to The Flaw of Averages that states "...average assumptions are wrong on average."
The Big Idea
The big idea here is to represent uncertainties as data arrays in a sharable, compact (~2kb), auditable form. I call this chance-data. It's a concept invented and promoted by Prof. Sam Savage of Stanford. Chance-data obeys both the laws of arithmetic and the laws of probability. Each value in the array represents a possible future outcome or scenario. Think of a ‘what-if’ scenario if you’ve ever used Excel. ‘What if we sold 1000 units more? Will we have enough inventory to fulfill the demand?’ In a spreadsheet we would change an input value to see what the outcome would be. Simple enough. Now imagine having millions of possible future outcomes.
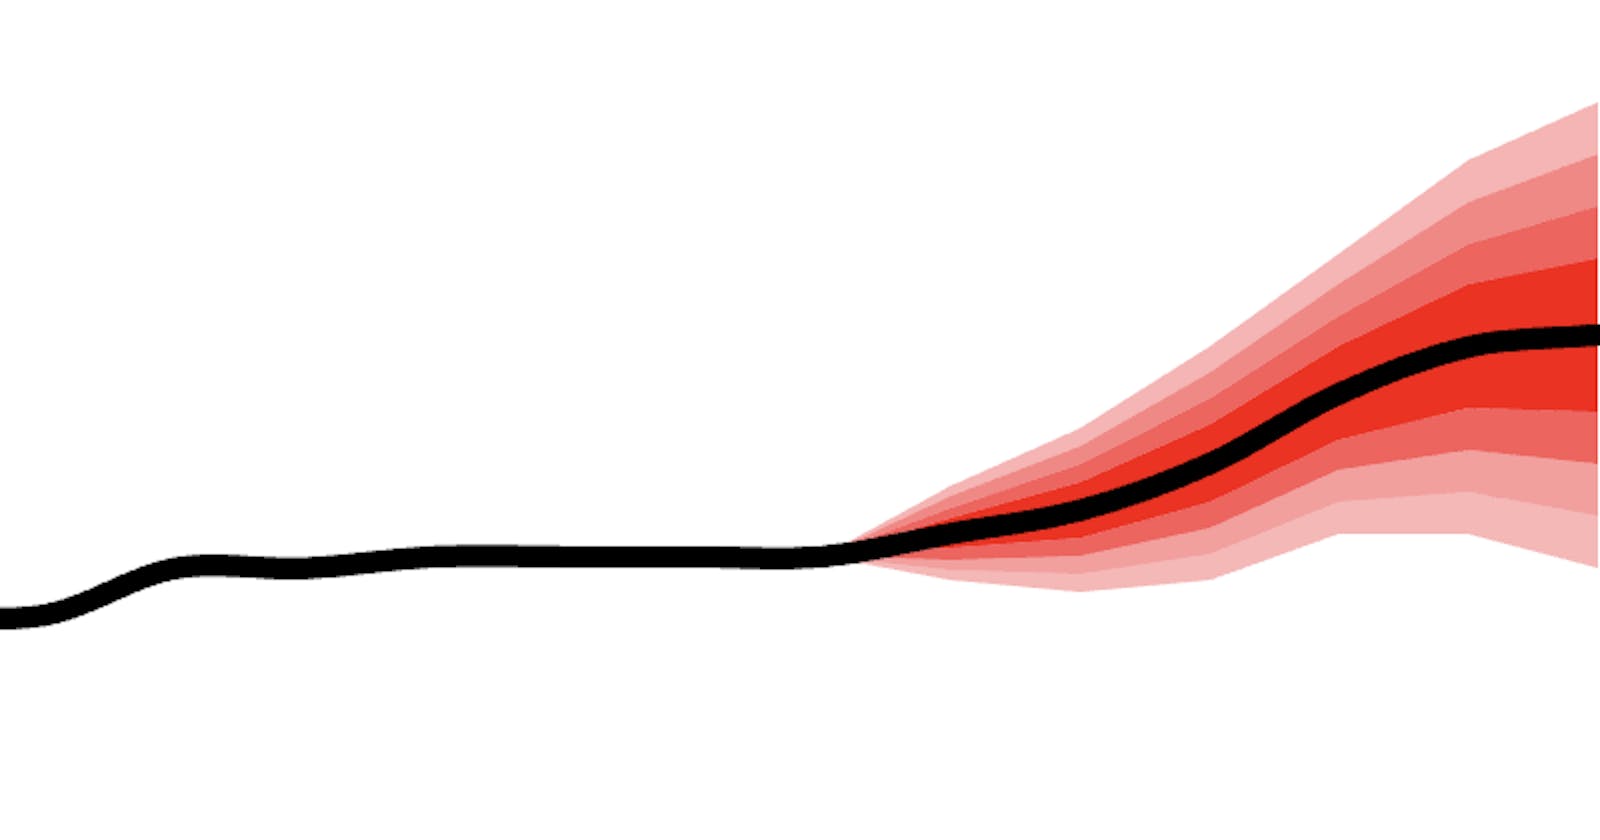
Take the array of those possible future values and create a histogram. The histogram is a graph that represents the distribution of the values. The graph depicts the probability of each possible future value. So, if you have an array of values that all have the same probability, the graph will be a straight line or what’s called a uniform distribution. Think of rolling a six-sided die. The probability of rolling a 1 is the same as rolling any other number but many uncertainties have different shapes and their histogram may look like a bell curve, or a ski jump, a skateboard ramp and anything in between. Some of you may be thinking ok, so what? Nothing new here.
This is a P.I.T.A.
Historically analytics professionals would fit data to a probability distribution. The most well-known being a so-called normal distribution or Gaussian distribution. There are over a hundred distributions mostly named after dead statisticians. The trick, art, sorcery is to pick the correct distribution for your data. Not always an easy task. Which distribution? What parameters should feed that distribution...? it's not fun. If you've ever struggled to find the correct distribution to fit your data and have considered quitting the field and forgetting everything you know about stats, because you just can't win, I've got a therapist for you...
Enter Metalog Distributions
In 2016 Tom Keelin published the first paper describing metalogs. Metalogs are just that - a distributions that comes after you've struggled to find the correct distribution to fit your data... kidding aside metalogs encompass 60+ traditional continuous distributions in one technique. So now we can 'fit' data to a metalog, and we don't need to do as much guessing. A lot of data observations go in and the metalog function spits out a handful of coefficients Great we have compressed the shape down to a few numbers. Kinda cool.
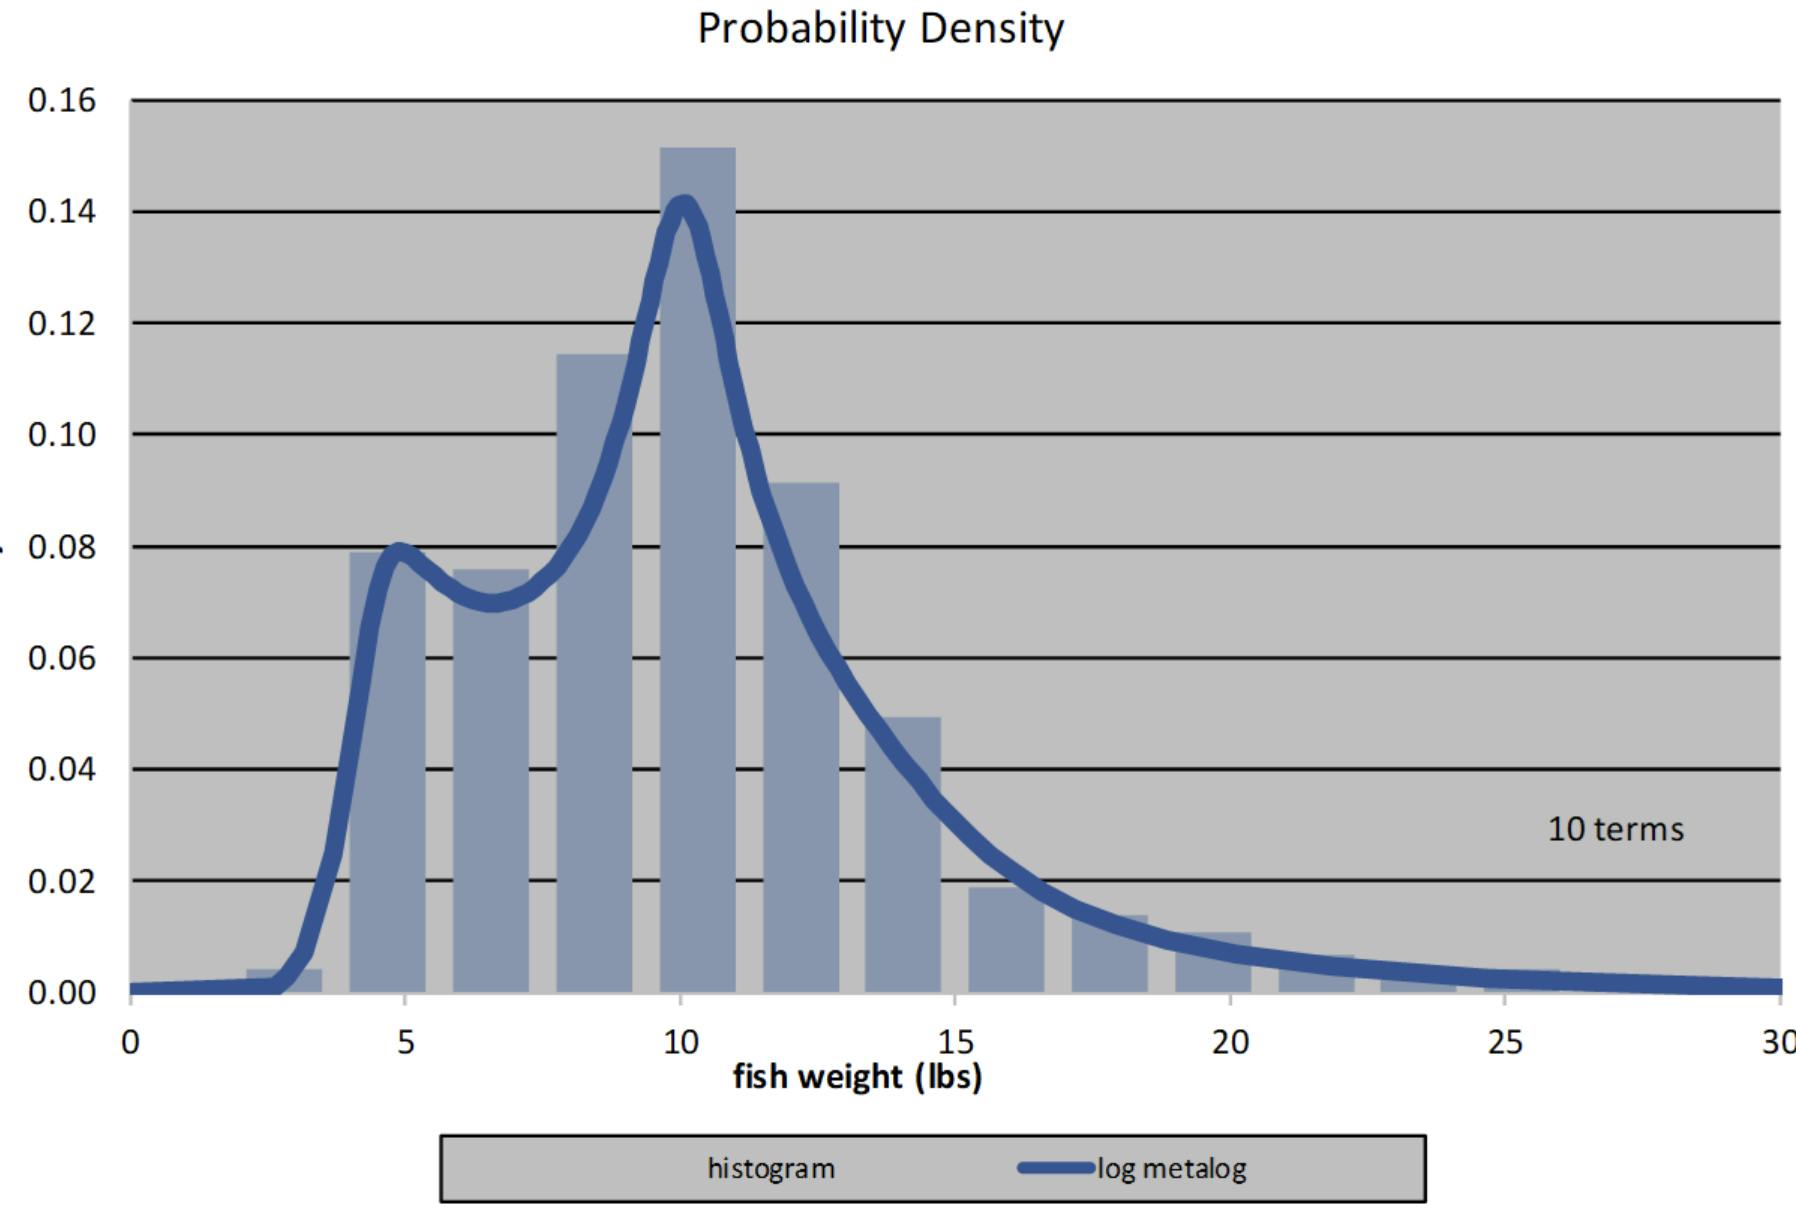 Source Wikipedia
That's Interesting
Where it gets interesting is when you have more than one uncertain variable AND you want to share those with others. How do you get two people to have the exact same Monte Carlo results when Monte Carlo is random? That's where Sam Savage has been focusing. He started off by freezing the Monte Carlo trials as vectors (arrays for us devs). Pass those frozen vectors around and everybody has the same result. Cool. BUT too much data too small pipes.
Prior to metalogs Savage had first invented something called a DIST String. It was a technique for packaging the vectors as base64 encoded strings. He added some metadata, was smart about binning the data before encoding it so the 'average' could be preserved and viola the DIST String was small enough to fit into an excel cell. He went on to call a single uncertainty packaged up like that a SIP short for Stochastic Information Packet. When there is more than one uncertainty, and they are related to each other, that forms a SLURP - stochastic library with relationship preserved.
But Wait There's More
OK. So, we have this fitting with metalogs and the idea of freezing trials and compressing them. Cool but there's still some challenges when one goes to share these 'things'. Different devices generate different random numbers. What we want is to know that when anybody anywhere looks at a probability distribution that they are looking at exactly the same data. This helps with auditability, replicable results, and provides a common understanding. To do this a seeded pseudo random number generator is needed. No big deal those have been around forever. Doug Hubbard (the How To Measure Anything guy) creates a tiny little PRNG formula called an HDR that supports 4 seeds. Kinda cool. Necessary? hmm not sure.
Don't Be Mean
Sam Savage is in LOVE with Excel nearly as much as he is with the mission of curing the flaw of averages, so he uses the HDR with metalogs to create interactive simulations in Excel. Not stopping there he and goes on to define a specification for sharing the probability distributions called SIPMath.This specification preserves the shape and relationships found in uncertainties and puts them into tiny little JSON file that is easily shared and consumed in Python, JavaScript and other programming languages. It’s a type of data Lego that compresses massive amounts of data into a portable format.
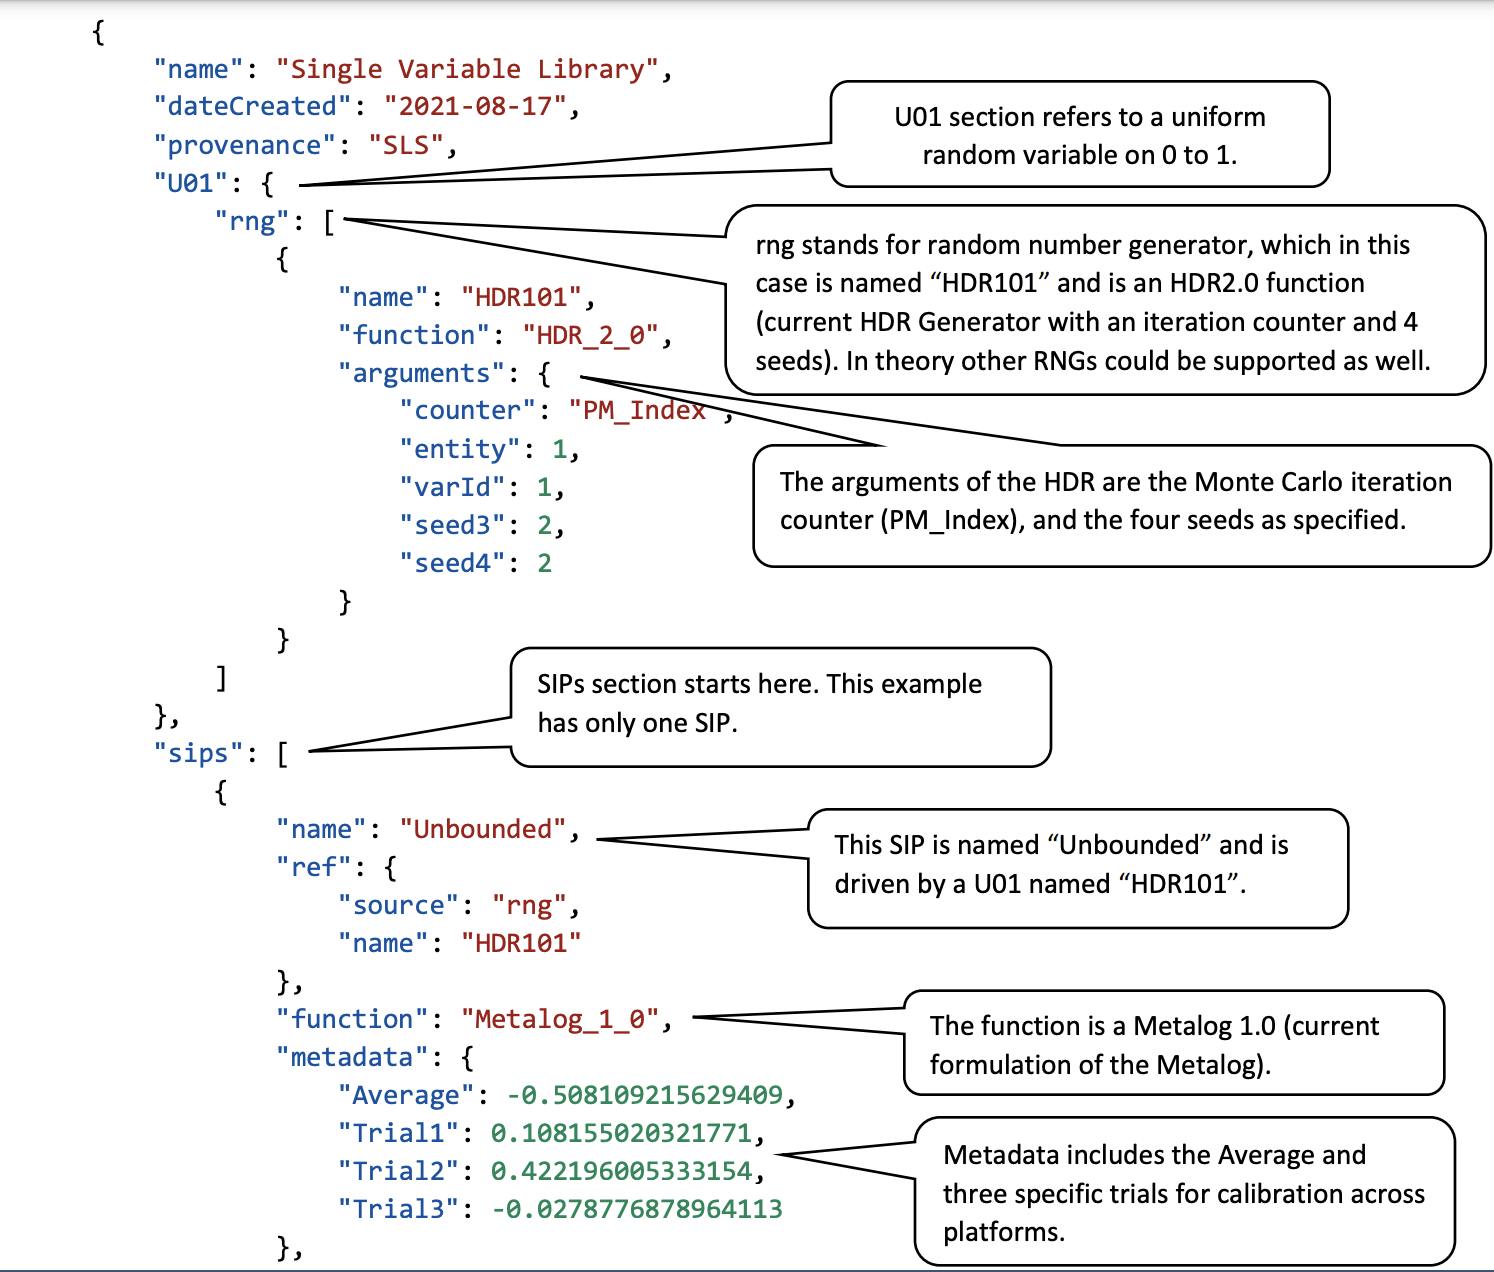 Source ProbabilityManagement.org
Models don't need to rely on average assumptions. It's no accident averages are referred to as the mean. They can be cruel to your models and mislead people into making suboptimal decisions. By feeding AI models chance-data your apps will help users avoid the flaw of averages and shine a light on the range of possibilities.
If you'd like to learn more about this topic join us in the discord where we are creating a public utility to help people answer the question, what's the chance of something happening?